

Most construction projects drown in data while starving for information. Superintendents texting photos, foremen scribbling on paper forms, project engineers updating spreadsheets, and PMs trying to piece together what's actually happening on site. Meanwhile, executives are asking for dashboard updates that take hours to pull from scattered sources.
The problem isn't lack of data. It's lack of architecture.
After watching construction companies burn through three, four, sometimes five different field reporting apps, the pattern is always the same. They keep adding tools thinking technology will fix their information flow. But without a clear data schema, ownership rules, and decision triggers, you're just creating digital versions of the same broken process.
Why construction data breaks between field and office
Construction generates massive amounts of field data every single day. Quality checks, safety observations, material deliveries, labor hours, equipment usage, weather conditions, RFIs, change orders. Each data point lives in someone's phone, tablet, or clipboard.
The typical flow goes something like this: foreman fills out a daily report at 3pm, emails it to the superintendent by 4pm, superintendent reviews and forwards to the project engineer by end of day, PE enters it into a tracking spreadsheet the next morning, PM pulls reports for the weekly meeting three days later. By the time data reaches decision makers, it's stale.
What makes this worse is that different trades use different systems. Concrete crews track pour data one way, steel erectors another, MEP contractors have their own process. The GC's project team ends up spending half their time translating between formats instead of actually analyzing trends.
Then there's the ownership problem. When concrete strength tests come back low, who owns that data? The testing lab? The concrete sub who ordered the mix? The structural engineer who needs to review it? The GC coordinating the resolution? Without clear ownership, critical information sits in email threads while work continues on potentially compromised structures.
The minimal schema that captures what matters
Most construction companies try to capture everything. Every photo, every conversation, every minor deviation. The result is noise that buries the actual signals.
Keep your construction projects on schedule and budget.
Projbrick helps you plan, track, and manage every project phase with precision and ease.
- Real-time project tracking
- Resource & budget management
- Team collaboration tools
No credit card required
A functional field-to-office data strategy for construction starts with a minimal schema focused on decision triggers. Not every data point needs real-time tracking. Not every metric needs a dashboard.
Start with three data categories:
Critical path data — anything that affects schedule milestones. Completed activities, blocking issues, resource constraints, dependency status. If it can delay your next milestone, it belongs here.
Cost variance data — actual quantities, change order status, T&M tickets, material waste. Not estimates or projections, but field-verified numbers that affect your cost-to-complete.
Risk indicator data — safety observations, quality deviations, weather delays, compliance issues. These are leading indicators that predict future problems, not lagging reports of problems that already happened.
Three categories. Everything else is noise until you nail these fundamentals.
For each category, define exactly five fields:
-
What happened (the fact)
-
Where it happened (location/system)
-
When it happened (timestamp)
-
Who recorded it (source)
-
What decision it triggers (action required)
This schema works because it forces clarity. A concrete pour isn't just "complete" — it's 240 cubic yards placed in Zone A foundation at 10:30am by Foreman Garcia, triggering rebar inspection for tomorrow's Zone B pour.
Integration mapping that connects BIM, schedule, and budget
Once you have your minimal schema, you need to map it to your three core systems: BIM for spatial context, schedule for temporal context, and budget for financial context.
The integration map doesn't require automated API connections — though that helps. It means defining exactly how field data updates each system.
BIM integration requires location coding. Every field data point needs a spatial reference that matches your model structure. Not "northeast corner" but "Grid E-4, Level 2, Area B2-4." When multiple quality issues cluster in one area, you can spot systemic problems instead of treating each one as isolated.
Schedule integration means mapping field activities to schedule activities. Your schedule might show "Install MEP rough-in Level 3" as one line item, but field data tracks a dozen parallel activities. Ductwork at 50% complete doesn't mean electrical is 50% complete, even if they sit under the same schedule line.
Budget integration requires quantity tracking at the cost code level. Your budget has line items like "03300 — Cast in Place Concrete" but field reports track trucks, yards, and overtime hours. Build a crosswalk between field units and budget units. Seven trucks at 10 yards each with two hours of overtime maps to specific cost impacts — that connection needs to be explicit.
Visualizing the mapping as a simple workflow helps align teams on where each data element lands.
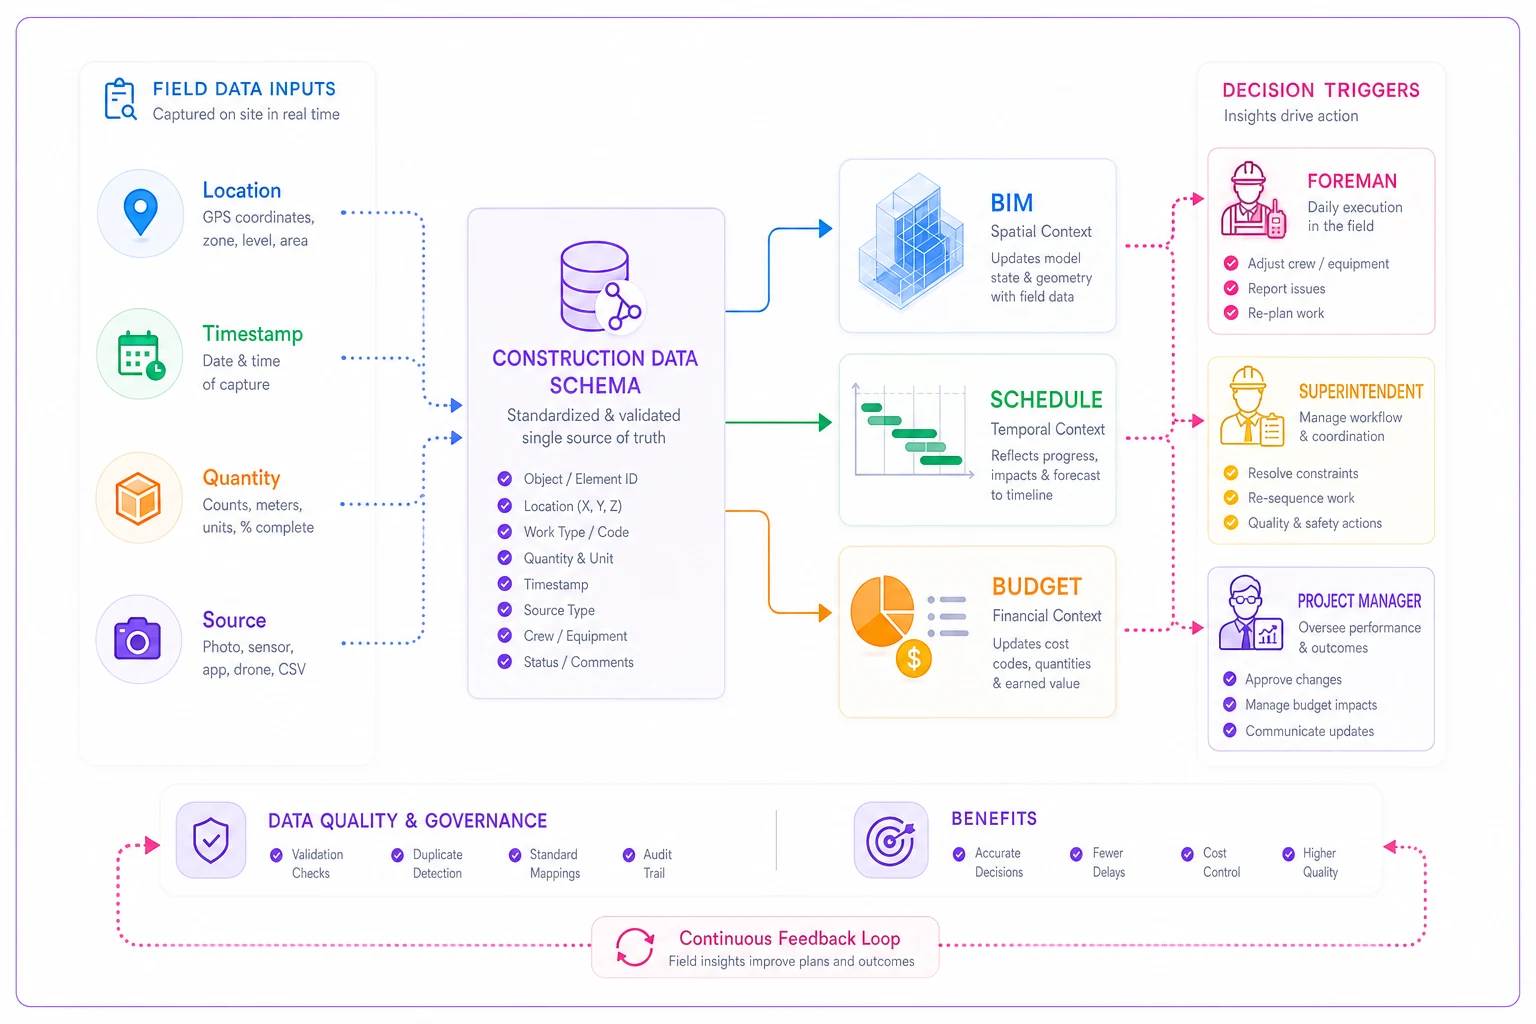
Keep these mappings simple and consistent. Don't try to integrate everything. Focus on the data that actually drives decisions.
Ownership rules that eliminate confusion
Data without ownership is just digital litter. Every piece of information needs a creator, validator, and decision maker.
The creator generates the data — usually field personnel. The validator confirms accuracy — typically a superintendent or QC manager. The decision maker acts on the information — often a PM or executive.
Here's a basic ownership matrix that works:
| Data Type | Creator | Validator | Decision Maker | Response Time |
|---|---|---|---|---|
| Daily production | Foreman | Super | PM | End of shift |
| Quality issues | QC inspector | QC manager | PM/Engineer | 4 hours |
| Safety incidents | Any worker | Safety manager | PM/Exec | Immediate |
| RFIs | PE | PM | Design team | 48 hours |
| Change orders | PM | Exec | Owner | 5 days |
| Material delays | Foreman | Super | PM/Procurement | Same day |
Notice the response times. Without deadlines attached to data, it just sits there. A quality issue identified Monday shouldn't wait until Thursday's coordination meeting.
Make response times visible in the field app so validators see deadlines and can prioritize reviews.
Ownership also means access control. Field workers need their daily targets and immediate feedback. Superintendents need cross-trade visibility. PMs need trends and exceptions. Executives need milestone status and major variances.
Build permissions around decision needs, not org chart hierarchy. A concrete foreman needs to see tomorrow's rebar status even though rebar isn't his trade. A PM doesn't need every daily report, just the exceptions.
Three dashboards mapped to decisions and governance
Daily Operations Dashboard (Field)
This dashboard runs the job site. Updated continuously, reviewed at daily huddles, focused on the next 48 hours.
-
Today's planned vs. actual activities
-
Tomorrow's work readiness (labor, material, equipment confirmed)
-
Active constraints and blockers
-
Safety observations trending negative
-
Weather impact on today and tomorrow
This dashboard drives immediate action. If a concrete delivery is delayed two hours, the super needs to know now to reassign crews. If tomorrow's crane isn't confirmed, someone needs to call the rental company today.
Format this for mobile viewing. Superintendents check it between field walks, not from a desk. Big numbers, color coding, minimal text. Red means stop work, yellow means at risk, green means proceed.
Weekly Coordination Dashboard (Management)
Updated daily, reviewed at weekly coordination meetings, focused on the next two to four weeks.
-
Productivity trends by trade compared to baseline
-
Cost variance by system and area
-
Upcoming milestone readiness (percent complete on predecessor activities)
-
Change order impact on critical path
-
Quality issues by trade and area (heat map)
-
Resource conflicts over the next two weeks
This dashboard drives coordination decisions. If steel erection is outpacing deck installation, you need to slow steel or accelerate decking. If change orders are clustering in one area, you might have a design issue that needs broader resolution.
Structure this around exception reporting. Don't show what's on track — show what's deviating. Use trend lines, not point-in-time data. A productivity dip might be weather-related, but a two-week declining trend indicates something systemic.
Monthly Governance Dashboard (Executive)
Updated weekly, reviewed at monthly governance meetings, focused on project completion.
-
Cost to complete vs. budget
-
Cash flow projection over the next 90 days
-
Risk register status (top five risks with mitigation progress)
-
Change order log with approval status
-
Safety incident frequency rate trend
This dashboard drives resource allocation and risk mitigation. If you're burning cash faster than billing, executives need to accelerate invoicing or secure additional financing. If multiple projects show similar delays, you might need to adjust company-wide resource allocation.
Keep it high-level but actionable. Include variance explanations directly in the dashboard — don't make executives hunt for why a metric shifted.
The governance cadence that makes data actionable
Data without decisions is just expensive record keeping.
Daily field huddles (15 minutes, on site): Review the daily operations dashboard, assign immediate actions, confirm tomorrow's plan. This isn't a status meeting — it's a decision meeting. Who's doing what today to keep tomorrow on track?
Weekly coordination meetings (1 hour, all trades): Review the weekly coordination dashboard, resolve conflicts, adjust the two-week look-ahead. Focus on handoffs between trades and resource conflicts. Don't rehash daily issues unless they point to something systemic.
Monthly governance reviews (2 hours, executive team): Review the monthly governance dashboard, approve changes, allocate resources. This meeting authorizes spending, approves schedule modifications, and escalates unresolved issues.
The critical piece is decision documentation. Every meeting produces specific actions with owners and deadlines. Not "look into concrete delays" — but "PM Smith meets with the concrete sub tomorrow and reports alternate suppliers by Thursday."
What breaks when you scale this system
This minimal architecture works well for single projects up to roughly $50 million. Beyond that, you run into real scaling issues.
First, data volume overwhelms manual validation. When you're tracking 500-plus workers across multiple shifts, superintendents can't validate every time entry. You need automated exception flagging to surface entries outside normal ranges for human review.
Second, integration complexity multiplies fast. Each subcontractor brings their own systems. Your electrical sub uses one field app, mechanical uses another, concrete subs use paper forms. Building bi-directional integrations with dozens of systems isn't practical. You need a data ingestion layer that standardizes inputs before they hit your schema.
Third, governance cadence compresses on fast-track work. Waiting a week for coordination decisions kills momentum. You might need daily coordination on critical path activities while keeping weekly reviews for everything else.
The fix isn't adding complexity — it's adding automation. AI-powered tools can pre-process field data, flag anomalies, and suggest actions before human review. Natural language processing can extract structured data from unstructured field notes. Pattern recognition can catch quality issues before they become defects.
Making this work with modern operational tools
The manual version of this system requires disciplined people following consistent processes. That works until someone goes on vacation, switches projects, or just has a bad week.
Modern construction operations platforms handle the repetitive parts while preserving human judgment for complex decisions. Field data capture happens through mobile apps with dropdown menus instead of free text. Integration mappings run automatically instead of through manual spreadsheet updates. Dashboards refresh continuously instead of weekly PowerPoint creation.
The real value isn't replacing human decisions — it's eliminating the busywork that prevents good ones. When your project engineer spends four hours weekly compiling reports, they're not analyzing trends. When your superintendent spends an hour daily transcribing field notes, they're not walking the job site.
AI automation particularly helps with pattern recognition across projects. A quality issue that looks isolated on your project might match patterns from two or three other jobs, pointing to a systemic supplier problem. A productivity trend that looks weather-related might actually correlate with crew composition changes.
The key is maintaining your minimal schema even as you add automation. Don't let technology vendors convince you to track fifty new metrics just because their system can. Every additional field needs to map to a specific decision, owner, and governance cadence.
The difference between data and decisions
Most construction companies think their field-to-office data problem is technical. They evaluate software features, integration capabilities, and dashboard designs. But broken data flow is usually a governance problem disguised as a technology problem.
You can have the best field apps, seamless integrations, and beautiful dashboards. Without clear ownership, decision triggers, and governance cadence, you're just moving data faster without improving decisions.
Start with the minimal architecture described here. Define your schema, map your integrations, assign ownership, build three dashboards, establish your governance cadence. Run it manually for a month if you have to. Once you understand what decisions you're actually making with data, then add technology to make those decisions faster and better.
The goal isn't perfect data or real-time everything. It's getting the right information to the right person at the right time to make the right call. In construction, that usually means knowing what's blocking tomorrow's work before you leave site today.
Your field generates thousands of data points daily. You probably make a dozen or so critical decisions each week. Build your field-to-office data strategy around those decisions, not around the data. That's how you turn information into action, and action into on-time, on-budget delivery.
Ready to build smarter and faster?
Join 2,000+ construction teams using Projbrick to improve project visibility, reduce delays, and increase profitability.