



Here's the uncomfortable thing about portfolio reporting in construction: most of it is fiction dressed up as data. Not because anyone's lying, but because "Schedule Performance Index" on Project A and "SPI" on Project B are measuring two different things, calculated by two different people, pulling from two different baselines that were updated on two different dates. Both numbers land in a portfolio dashboard, get averaged, and a VP makes a staffing decision based on a blend of apples and sawdust.
The root problem isn't dashboards. It's that there's no shared construction KPI taxonomy — no agreed definition of what each metric means, who owns the number, and what counts as a valid data source. Until you fix that, every rollup you build is just aggregating noise with confidence.
This article is about the governance layer underneath the dashboards. Not which charts to show, but how to make a metric comparable across ten jobs run by ten PMs who each have their own habits.
Why portfolio KPIs quietly fall apart
The failure almost never looks like a failure. Each project team is doing reasonable work. The breakdown happens in the seams between them.
A typical pattern: three project managers all report "% complete" for their structural phase. One is reporting physical progress — concrete poured vs. total planned. One is reporting earned value against budget. One is eyeballing it based on how the site looks on a Friday afternoon. All three type "68%" into a field labeled the same way. The portfolio rollup treats them as identical. They're not even the same category of measurement.
Multiply that across cost variance, RFI turnaround, change-order aging, safety rates, and productivity, and you get a portfolio view where the numbers are internally inconsistent in ways nobody can see from the top.
-
Different baselines. One PM rebaselines after every approved change. Another freezes the original baseline and tracks drift separately. Their variance numbers aren't comparable, even if the formula is identical.
-
Different cutoff dates. Team A reports as of the 25th, Team B as of month-end. Four to six days of movement gets silently blended.
-
Different source systems. Field productivity from a spreadsheet on one job, from the scheduling tool on another, from a superintendent's memory on a third.
-
Different definitions of "done." Is a change order counted when submitted, when priced, or when executed? Each PM has an answer, and they rarely match.
None of these are exotic problems. They're the default state of any portfolio that grew project by project without a governing taxonomy imposed on top.
The three things a KPI taxonomy actually governs
A real taxonomy does more than list metric names. It pins down three things for every KPI:
Keep your construction projects on schedule and budget.
Projbrick helps you plan, track, and manage every project phase with precision and ease.
- Real-time project tracking
- Resource & budget management
- Team collaboration tools
No credit card required
-
Definition and formula — exactly what's being measured and how it's computed, including the specific inputs and their units.
-
Data ownership — who is accountable for the number being correct, and who is merely a contributor.
-
Comparability rules — the constraints that must hold for this metric to be legitimately compared across projects: baseline treatment, cutoff timing, source system.
Skip any of the three and the KPI leaks. A perfect formula owned by nobody drifts. A clear owner with a vague formula produces precise-looking garbage. Both of them together with no comparability rule produce numbers that are individually correct and collectively meaningless.
A mandatory KPI catalog (the starting core)
You don't need 80 metrics. Across most portfolios, a tight core of 12–15 KPIs carries almost all the decision weight. Start there, lock the definitions hard, and resist the urge to let every project add its own flavor.
Here's a core catalog with the pieces that usually get left ambiguous made explicit.
| KPI | Formula | Primary Unit | Comparability Rule |
|---|---|---|---|
| Schedule Performance Index (SPI) | Earned Value ÷ Planned Value | ratio | Must use the current approved baseline, not original; cutoff = month-end |
| Cost Performance Index (CPI) | Earned Value ÷ Actual Cost | ratio | Actuals must include committed-but-uninvoiced costs |
| Schedule Variance (days) | Current forecast finish − baseline finish | calendar days | Measured on the project critical path only |
| Change Order Value Ratio | Approved CO value ÷ original contract value | % | Counted at execution, not submission |
| Change Order Aging | Avg days from submission to disposition | days | Open items included at report date |
| RFI Turnaround | Avg days from RFI issued to answered | days | Business days; clock stops only on formal hold |
| Productivity Factor | Earned hours ÷ actual hours | ratio | By trade; no blended all-trade number in rollups |
| Recordable Incident Rate | (Recordables × 200,000) ÷ hours worked | rate | Hours = all workers on site, subs included |
| Forecast Cost at Completion | Actual + (Remaining work ÷ CPI) | currency | CPI-based method mandatory for rollup consistency |
| Committed Cost % | Committed ÷ total budget | % | Commitments = executed POs + subcontracts |
| Milestone Hit Rate | Milestones met on time ÷ milestones due | % | Only contract/phase-gate milestones count |
| Open NCR Count | Count of non-conformances not yet closed | count | Closed = verified, not just "actioned" |
The column doing the real work is the last one. The formula column is where people think the precision lives, but the comparability rule is where portfolios actually succeed or fail. Two PMs can both compute CPI correctly and still produce incomparable numbers if one includes committed costs and the other doesn't.
Worth internalizing: the metrics people fight over hardest — SPI, CPI — are usually less dangerous than the quiet ones like Committed Cost % and Change Order Aging. Everyone scrutinizes the famous ratios. Nobody consistently checks whether "committed" means the same thing on every job.
The data-ownership matrix
A KPI with no clear owner becomes everyone's job, which means it's nobody's. The ownership matrix fixes accountability per metric, and it needs to separate three distinct roles that teams routinely collapse into one.
-
Owner — accountable for the number being right. One person. Not a department.
-
Producer — generates the underlying data
field counts, cost ledger entries, incident logs.
-
Validator — independently checks the number before it rolls up.
A workable matrix for the core catalog:
| KPI | Owner | Producer | Validator |
|---|---|---|---|
| SPI / Schedule Variance | Project Scheduler | Site superintendents | PMO controls lead |
| CPI / Forecast CAC | Project Cost Manager | AP + commitments clerk | Finance controller |
| Change Order metrics | Commercial Manager | Document controller | PMO |
| RFI Turnaround | Design Coordinator | RFI log system | PMO |
| Productivity Factor | Field Engineer | Foreman timesheets | Project Cost Manager |
| Safety rates | Safety Lead | Site safety officers | Corporate EHS |
| NCR / Quality | QA/QC Manager | Inspectors | PMO |
The most common ownership mistake: making the PMO the owner of operational KPIs. The PMO should validate and aggregate, not own the source number. When the PMO "owns" SPI, the scheduler stops feeling accountable for it, and the number degrades into something the PMO has to constantly chase and reconstruct. Ownership belongs with whoever controls the underlying work.
This ties directly into how your field data is structured and who's responsible for each field at the source. If you haven't nailed that down already, the logic in a field-to-office data strategy with a minimal schema and ownership rules is the foundation this whole taxonomy sits on — you can't govern a KPI whose raw inputs have no owner.
Enforcement: the part everyone skips
Writing the taxonomy is the easy 20%. Making projects actually comply is the 80% that determines whether any of this survives contact with a busy PM three months from now.
Enforcement fails when it's voluntary. A beautifully documented standard that lives in a SharePoint folder gets ignored the first time a deadline gets tight. The enforcement has to be built into the reporting mechanism itself, so a non-conforming number either can't be submitted or gets flagged automatically before it reaches the rollup.
A practical enforcement checklist to run before any project KPI enters the portfolio view:
-
[ ] Baseline check — Is the metric computed against the current approved baseline (not original, not an informal working version)?
-
[ ] Cutoff alignment — Is the data-as-of date within the agreed reporting window for the whole portfolio?
-
[ ] Source verification — Did the number come from the designated system of record, not a side spreadsheet?
-
[ ] Formula conformance — Does the calculation match the catalog definition exactly, including which costs and hours are in scope?
-
[ ] Owner sign-off — Has the named Owner (not a delegate, not the PMO) confirmed the number?
-
[ ] Validator pass — Has an independent Validator checked it against source before rollup?
-
[ ] Exception flagging — Are any deviations from the standard logged with a reason, not silently absorbed?
That last item matters more than it looks. Real projects will have legitimate exceptions — a brand-new job with no meaningful CPI yet, a phase where productivity tracking isn't set up. The goal isn't to pretend exceptions don't exist. It's to make them visible instead of letting them hide inside a blended average.
A workflow that makes enforcement automatic
The checklist only works if it's wired into the data flow, not run as a manual audit nobody has time for. A workable monthly rhythm looks like this: Producers enter raw data into the system of record throughout the period → at cutoff, calculated KPIs are generated automatically from that data using the locked formulas → the system flags any metric missing an owner sign-off, pulling from a non-standard source, or computed against the wrong baseline → Validators clear or reject flagged items → only cleared, conformant KPIs promote into the portfolio layer → exceptions roll up as a separate, visible list rather than contaminating the averages.
Here's a visual of that monthly enforcement workflow:
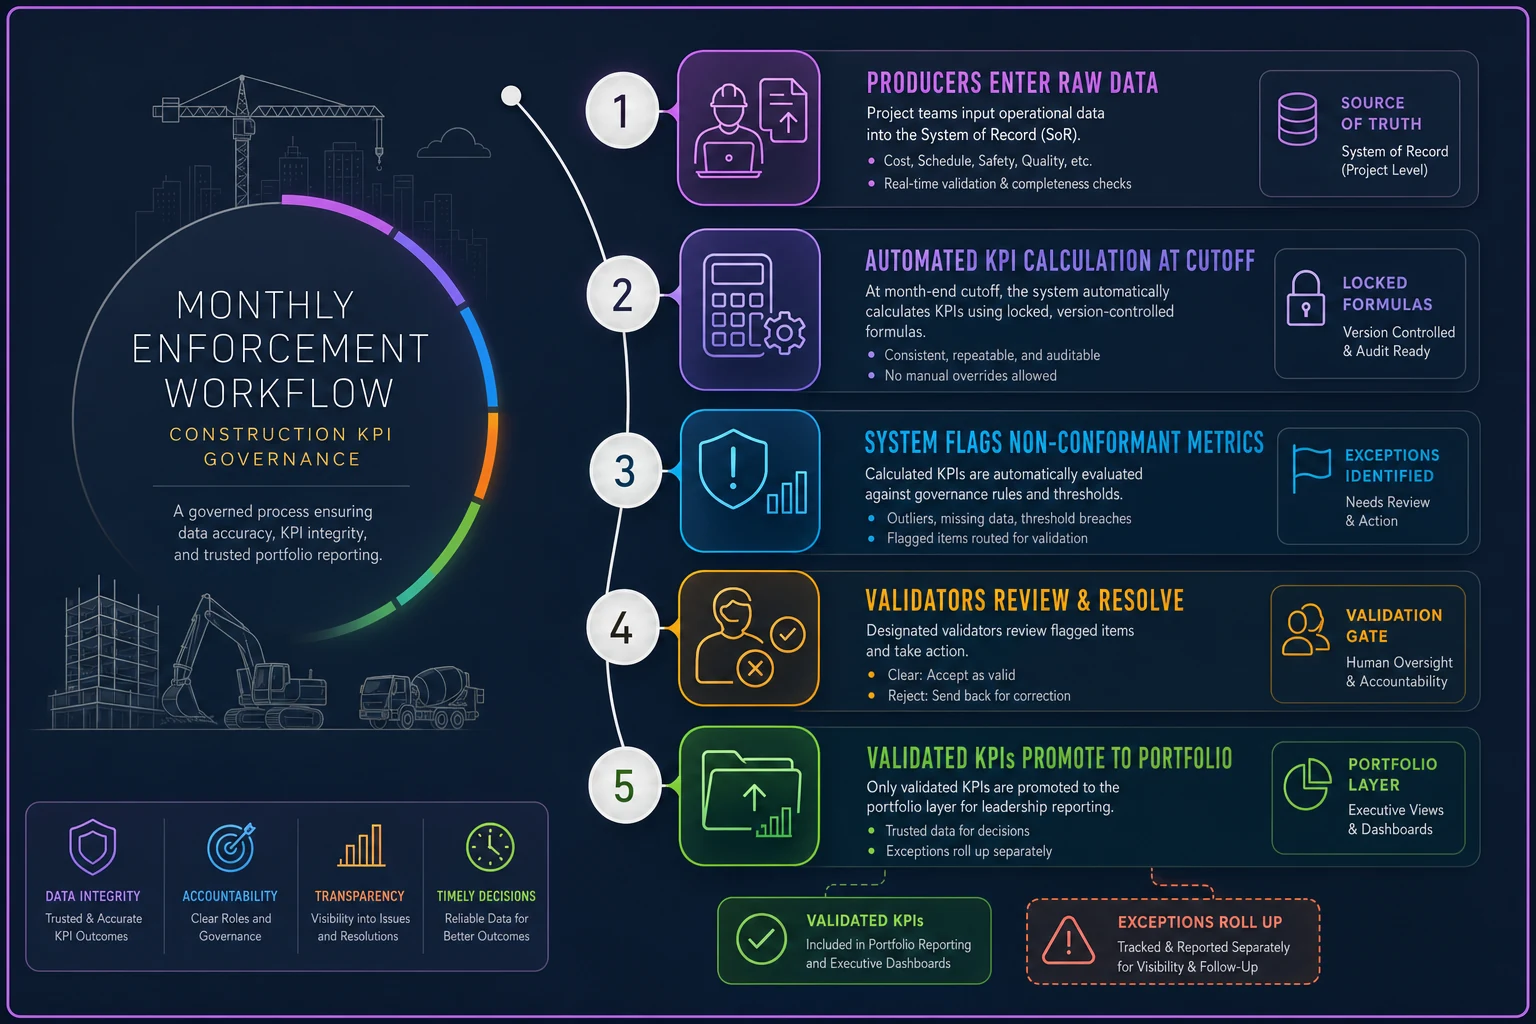
Build baseline and cutoff checks into the submission step so non-conformant data can't be promoted.
The key design principle: the dashboard should never calculate the KPI from scratch for each project. It should only ingest pre-validated, taxonomy-conformant numbers. The moment you let a BI tool compute "percent complete" eleven different ways from eleven different raw tables, you've recreated the exact problem the taxonomy was meant to solve. Operational platforms with AI-assisted validation can catch a lot of these conformance breaks before a human ever looks — flagging a CPI that excludes committed costs or an SPI run against an outdated baseline — which turns enforcement from a monthly firefight into something closer to a background process.
Example dashboard rules for portfolio rollups
Once the inputs are clean and conformant, the rollup rules determine whether the portfolio view tells the truth. A few rules that prevent the most common distortions:
-
Never average ratios across projects of different sizes. A CPI of 0.85 on a $2M job and 1.05 on a $40M job do not average to 0.95. Weight by cost or earned value, or show them separately.
-
Show count and coverage alongside every rolled-up metric. "Portfolio SPI: 0.97 (9 of 11 projects reporting, 2 pre-baseline)" is honest. "Portfolio SPI: 0.97" alone is a trap.
-
Keep exceptions out of the blend but visible on the page. Projects that can't yet report a metric get listed, not averaged in as zero or quietly dropped.
-
Flag stale data explicitly. Any project whose data-as-of date lags the portfolio cutoff gets a visible marker, not a silent inclusion.
-
Trace every rolled-up number to its owners. A VP should be able to click a portfolio CPI and see which projects, which owners, and which cutoff dates produced it.
Dashboards that drive good decisions are honest about their own uncertainty. A clean-looking number with no coverage context is more dangerous than a messy one that shows its seams.
A real scenario
A mid-sized GC running around 9 active projects — roughly $180M combined — had a recurring problem at monthly executive reviews. Portfolio CPI looked healthy, hovering around 0.98, but two jobs kept surprising everyone with cost overruns at closeout.
When they dug in, the cause was straightforward: taxonomy drift. Three of the project cost managers were computing CPI on invoiced actuals only, excluding committed-but-uninvoiced subcontract costs. On jobs with heavy sub exposure, that understated actual cost significantly and inflated CPI. Two of those three projects were the ones producing "surprises" — the overrun was already baked in, just invisible in the rollup.
They didn't buy new software first. They fixed the catalog: one CPI definition, committed costs mandatory, Finance controller as validator. They added the committed-cost check to the enforcement step so a non-conformant CPI couldn't promote to the portfolio layer. Within two reporting cycles, portfolio CPI dropped to a more honest 0.94 — lower, but real. The surprises stopped, because the overrun pressure started showing up months earlier, while there was still time to do something about it.
The number didn't improve. The truth of the number improved, which is the entire point. That same discipline underpins reliable forecasting more broadly — if your inputs aren't governed, your forecast-to-complete finance controls are predicting the future from a corrupted present.
When this level of governance makes sense — and when it doesn't
When it's worth it: You're running more than a handful of concurrent projects, decisions are being made at the portfolio level — staffing, cash, go/no-go — and different PMs run their jobs with meaningfully different habits. The more autonomy your project teams have, the more you need the taxonomy. Autonomy without shared definitions is exactly what produces incomparable numbers.
When it's overkill: A single large project, or two or three jobs run by the same tight team using identical processes. If everyone's already pulling from the same system with the same definitions out of habit, formalizing a 15-KPI catalog and a validator matrix is bureaucracy for its own sake. Govern the specific metrics that drive real decisions and leave the rest alone.
Who should not start here: Teams whose underlying field and cost data is still chaotic. A taxonomy sits on top of clean source data. If your productivity numbers come from a superintendent's memory and your commitments live in someone's inbox, fix the data capture and ownership at the source first. Governing bad data just produces well-organized bad data.
The thread that ties it together
Portfolio comparability isn't a reporting problem — it's a definitions problem. The dashboard is the last step, and it's the step everyone obsesses over, but it can only be as honest as the taxonomy feeding it. Lock the definitions, assign real owners per metric, enforce conformance before numbers roll up, and build rollup rules that refuse to hide their own gaps.
Do that, and the portfolio view stops being a monthly theater exercise and starts being something a VP can actually make decisions on. Skip it, and you'll keep averaging apples and sawdust — just with nicer charts.
Ready to build smarter and faster?
Join 2,000+ construction teams using Projbrick to improve project visibility, reduce delays, and increase profitability.