

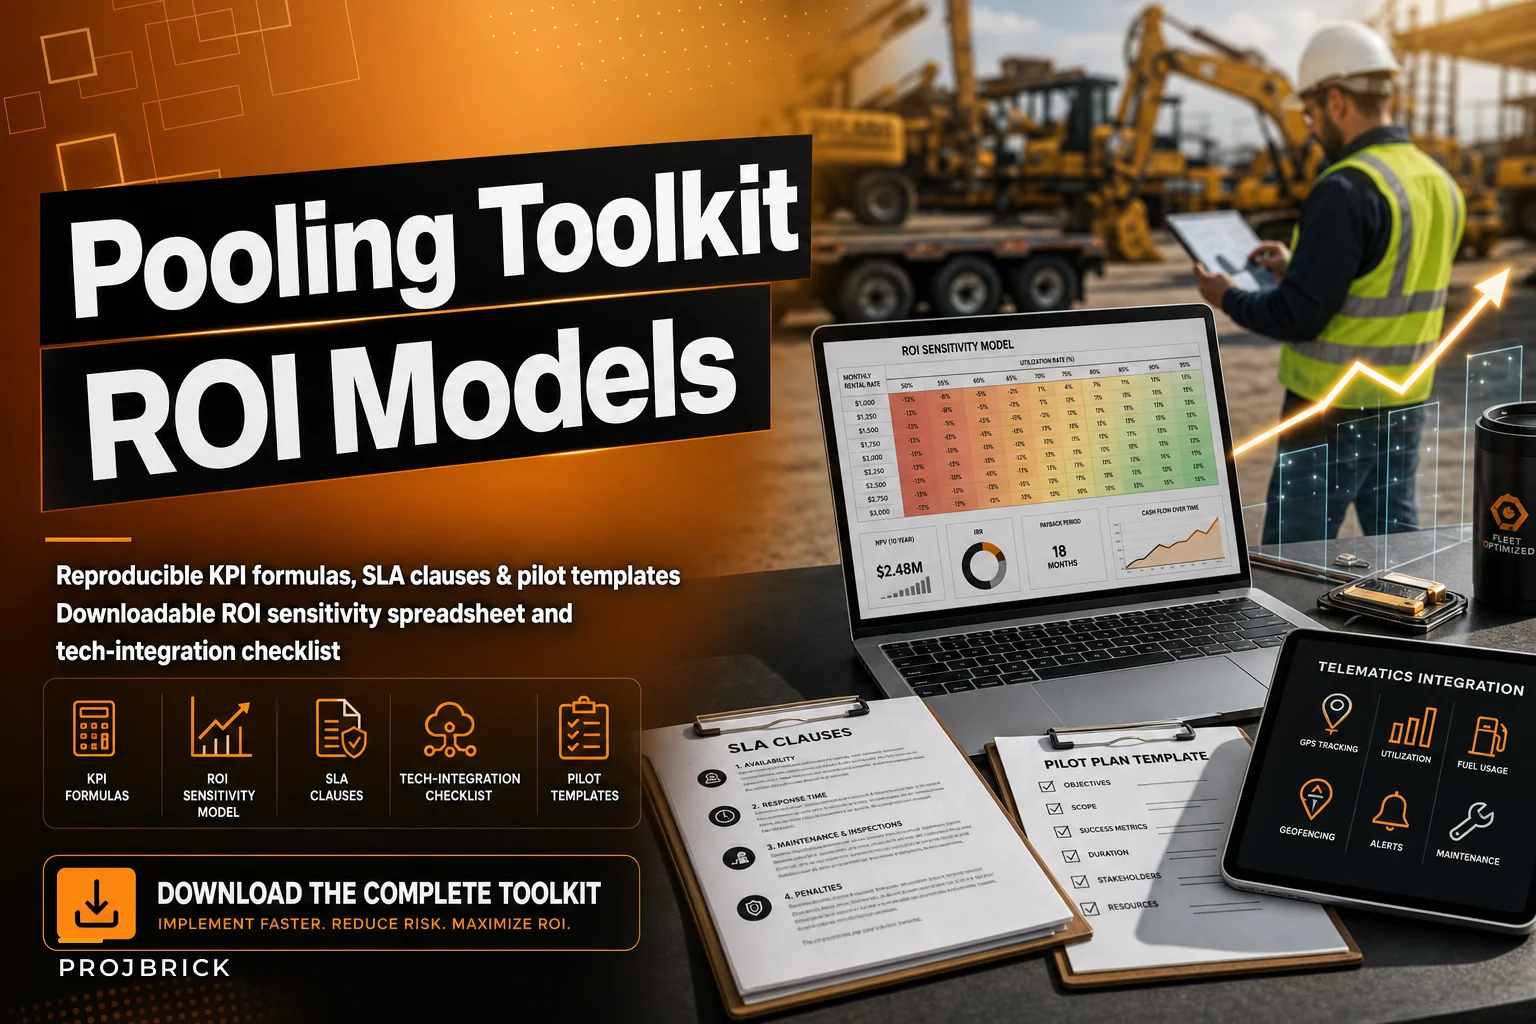

If you've already read through the strategy side of cross-site pooling and bought into the idea, you're probably stuck at the part that's hard to find anywhere online: proving it on paper before finance signs off, and running it without the whole thing collapsing into "who has the excavator this week" arguments.
This isn't a rehash of why pooling works or how to rank transfer priorities — the cross-site equipment-pooling playbook covers that ground. This is the implementation layer underneath it. The formulas you'll actually calculate, the ROI model that survives a CFO's scrutiny, the SLA language that keeps two project teams from blaming each other, and a pilot you can run in 4 to 12 weeks without betting the whole portfolio on it.
Start with the KPIs, because everything downstream depends on them
Most pooling programs die because the person championing it can't answer one question cleanly: "How much are we actually saving?" They wave at idle hours and rental invoices, but there's no reproducible formula behind it. Finance smells hand-waving and the program stalls.
Lock down the exact calculations before anything else. These need to be the same every time, calculated the same way at every site, or your comparisons are meaningless.
Utilization rate
Utilization % = (Productive Operating Hours ÷ Available Hours) × 100
The trap is "available hours." If one site counts available as calendar hours (24/7) and another counts scheduled shift hours, your utilization numbers are worthless across the pool. Pick one. In practice, scheduled-shift availability is more honest for construction — an excavator isn't "idle" at 2am if nobody's on site.
Use scheduled-shift availability for construction assets to avoid overstating idle time across sites.
Idle hours
Idle Hours = Available Hours − Productive Operating Hours − Justified Downtime Hours
Justified downtime matters. Maintenance, mandated inspections, weather lockouts — those aren't waste. If you lump them into idle, you overstate your savings opportunity and someone will tear your model apart.
Idle cost
Idle Cost = Idle Hours × Hourly Ownership Burden
Where:
Hourly Ownership Burden = (Depreciation + Insurance + Financing + Storage + Fixed Maintenance) ÷ Available Hours
Owners forget that owned equipment bleeds money while parked. A machine on a $9,500/month ownership burden sitting idle 55% of a 176-hour month is burning roughly $5,200 that month doing nothing. Multiply that across a fleet and the number gets uncomfortable fast.
Transfer efficiency
Net Pooling Benefit = (Avoided Rental + Reduced Idle Cost) − (Transfer Cost + Incremental Wear + Transfer Labor + Program Overhead)
That right-hand side is where pooling programs quietly lose money. The worked examples below account for all of it.
The ROI sensitivity model (and why a single-point estimate gets you burned)
The mistake that kills credibility: someone builds one spreadsheet, plugs in optimistic utilization uplift, shows a beautiful payback, and then reality comes in 30% softer. Now the whole program is "the thing that overpromised."
Keep your construction projects on schedule and budget.
Projbrick helps you plan, track, and manage every project phase with precision and ease.
- Real-time project tracking
- Resource & budget management
- Team collaboration tools
No credit card required
You need a sensitivity model, not a point estimate. Build it so the four variables that actually swing the outcome can each move independently:
| Variable | Pessimistic | Base | Optimistic |
|---|---|---|---|
| Utilization uplift | +8% | +15% | +24% |
| Transfer cost per move | $850 | $600 | $420 |
| Moves per month (portfolio) | 14 | 9 | 6 |
| Recurring program cost/mo | $4,200 | $3,000 | $2,100 |
The point isn't precision. It's showing finance the range. When you present pooling as "net savings somewhere between $38k and $94k annually depending on transfer discipline," you sound like someone who understands the risk — not someone selling a dream.
What goes in the downloadable spreadsheet
-
Inputs — ownership burden per asset class, rental day rates, current utilization, labor rates, fuel.
-
Rent vs Buy Breakpoint — annualized ownership cost vs cumulative rental spend, with the crossover highlighted.
-
Transfer Cost Model — per-move cost broken into transport, loading labor, incremental wear, fuel, and downtime during move.
-
Utilization Uplift — before/after utilization × ownership burden = recovered idle cost.
-
Recurring Program Costs — coordinator time, software/telematics subscription, chargeback admin.
-
Sensitivity Summary — the table above, with a tornado chart showing which variable moves ROI most.
In nearly every model built on real fleet data, moves-per-month is the sneaky killer. Teams model transfer cost carefully but underestimate transfer frequency. Every extra move isn't just dollars — it's wear, fuel, and a half-day of productive time lost on both ends.
Worked example 1: Pooling vs centralized rental
A contractor runs three sites needing a 4-ton telehandler intermittently.
Centralized rental approach:
-
Each site rents on demand
~$1,450/week, averaging 3 weeks/month across the portfolio
-
Monthly rental spend
roughly $4,350
-
No transfer cost, no ownership burden
-
Annual
about $52,000
Pooling two owned telehandlers across the three sites:
Ownership burden: ~$3,800/month for both units combined Utilization climbs from ~41% to ~63% after pooling Transfers: ~7 moves/month at $560 each (transport + loading labor + fuel) = ~$3,920 Incremental wear allocation: ~$340/month Coordinator overhead: ~$900/month Monthly total: roughly $8,960
At this transfer frequency, pooling two owned units loses against on-demand rental. The ownership burden plus transfer churn outweighs the rental avoidance.
The fix isn't abandoning pooling — it's reducing moves. Re-sequence the schedule so each telehandler stays on a site for 2–3 week blocks instead of bouncing weekly. Drop to ~3 moves/month:
Transfer cost drops to ~$1,680 Wear drops to ~$190 New monthly total: roughly $6,570
Now pooling wins by roughly $18k–$20k annually versus rental — but only because transfer discipline was fixed. This is the single most important lesson in the whole toolkit: pooling math is transfer-frequency math.
Worked example 2: Rent-vs-buy breakpoint with transfer wear accounted
A PM is deciding whether to buy a second compact excavator or keep renting to cover peak overlap.
Purchase: $68,000, financed, ~$1,250/month ownership burden all-in Rental alternative: $2,100/week when needed Expected need across the portfolio: variable, 2–4 weeks/month
The naive breakpoint says buy if you need it more than roughly 13 days a month. But once you pool the bought unit across sites, you add transfer wear and fuel that a dedicated rental doesn't carry. Fold in:
-
~4 transfers/month × $480 = $1,920 transfer cost
-
Incremental wear reserve
~$160/month
The true breakpoint shifts. With transfer costs loaded, you now need roughly 17–18 utilized days/month before buying-and-pooling beats renting. That's a meaningful difference — buying on the naive number and then discovering transfer costs eat the margin is how fleets end up overcapitalized.
Never run a rent-vs-buy breakpoint for a pooled asset without the transfer cost layer baked in. A dedicated asset and a pooled asset have fundamentally different cost curves.
Intercompany SLA and transfer clauses (steal these)
When two project teams — or two legal entities under one parent — share equipment, the arguments aren't about the equipment. They're about condition, timing, and who pays when something breaks mid-transfer. Put it in writing before the first move, not after the first dispute.
Core SLA clauses to include:
-
Availability commitment "Releasing site shall make the asset available at the agreed handoff point no later than [X] hours after the scheduled release time. Delays beyond [Y] hours incur an internal charge of [rate]."
-
Condition standard "Asset transfers in documented operating condition per the handoff checklist. Fuel level, fluid levels, and attachments logged at release and receipt."
-
Damage allocation "Damage identified at receipt that is not noted on the release checklist is allocated to the releasing site. Damage occurring during active use is allocated to the using site."
-
Transfer cost split "Transport and loading costs allocated to the receiving project unless the move is initiated to satisfy a higher-priority release, in which case [split rule]."
-
Priority override "Portfolio scheduler may override a scheduled retention where a higher-priority site has a critical-path need, subject to [notice period] and compensation to the displaced site."
Handoff checklist (use at every release and receipt)
-
[ ] Hour meter reading recorded (photo)
-
[ ] Fuel and fluid levels logged
-
[ ] Visual damage walk-around, photographed from 4 sides
-
[ ] Attachments/accessories inventoried against asset list
-
[ ] Last service date and next due confirmed
-
[ ] Known faults or warning lights noted in writing
-
[ ] Both site reps sign release/receipt record
-
[ ] Transfer logged in central system with timestamp
Teams that skip the photo step always regret it. "It was already scratched" is unwinnable without timestamped images.
The 4–12 week pilot template
Don't roll pooling across the whole portfolio on day one. Run a contained pilot, prove the numbers, then scale.
Pilot scope (keep it small)
-
2–3 sites, geographically close enough that transfers are realistic
-
One or two asset classes only — pick the ones with the worst measured utilization gap
-
8-week default duration, extendable to 12 if data is noisy
RACI for the pilot
| Activity | Responsible | Accountable | Consulted | Informed |
|---|---|---|---|---|
| Baseline utilization capture | Site PMs | Pilot Lead | Equipment Mgr | Finance |
| Transfer scheduling | Pool Coordinator | Pilot Lead | Site PMs | — |
| Handoff checklist compliance | Site Foremen | Site PMs | — | Pool Coordinator |
| KPI reporting | Pool Coordinator | Pilot Lead | Finance | Execs |
| Go/no-go decision | — | Sponsor | Finance, Pilot Lead | All |
Pilot execution steps
-
Week 0 Capture 2–4 weeks of baseline utilization and idle cost per asset. No baseline, no pilot — you'll have nothing to compare against.
-
Weeks 1–2 Stand up the transfer log and handoff checklist. Train foremen. Expect friction here.
-
Weeks 3–6 Run live pooling. Log every move with full cost detail. Hold a 15-minute weekly pooling sync.
-
Weeks 7–8 Calculate net pooling benefit using the formulas above. Compare against baseline and against the sensitivity model.
-
Go/no-go Present the range, not a single number. Recommend scale, adjust, or stop.
A script your coordinator can actually use
> "Which assets are releasing this week and when? Any critical-path conflicts for the next 10 days? Any open damage disputes? Any moves we can batch or avoid by re-sequencing?" That last question — moves we can avoid — should be asked every single week. It's where the savings get protected.
Tech integration: how the systems actually talk
You can run a small pilot on a spreadsheet. You cannot run a 20-site portfolio on one. Once pooling scales, the manual tracking becomes the bottleneck — someone spends half their week reconciling transfer logs, utilization data lives in four disconnected places, and chargebacks turn into monthly arguments.
TELEMATICS ──(engine hours, location, fault codes)──┐ │ RESERVATION ──(booking, release, transfer requests)──┤ PORTAL ▼ ┌──────────────────┐ │ Central Pooling │ │ Data Layer │ └──────────────────┘ ▲ CMMS ───────(service status, downtime, wear)──────────┤ │ ERP ───────(cost allocation, chargebacks)────────────┘
Here's a quick visual of how those systems connect.
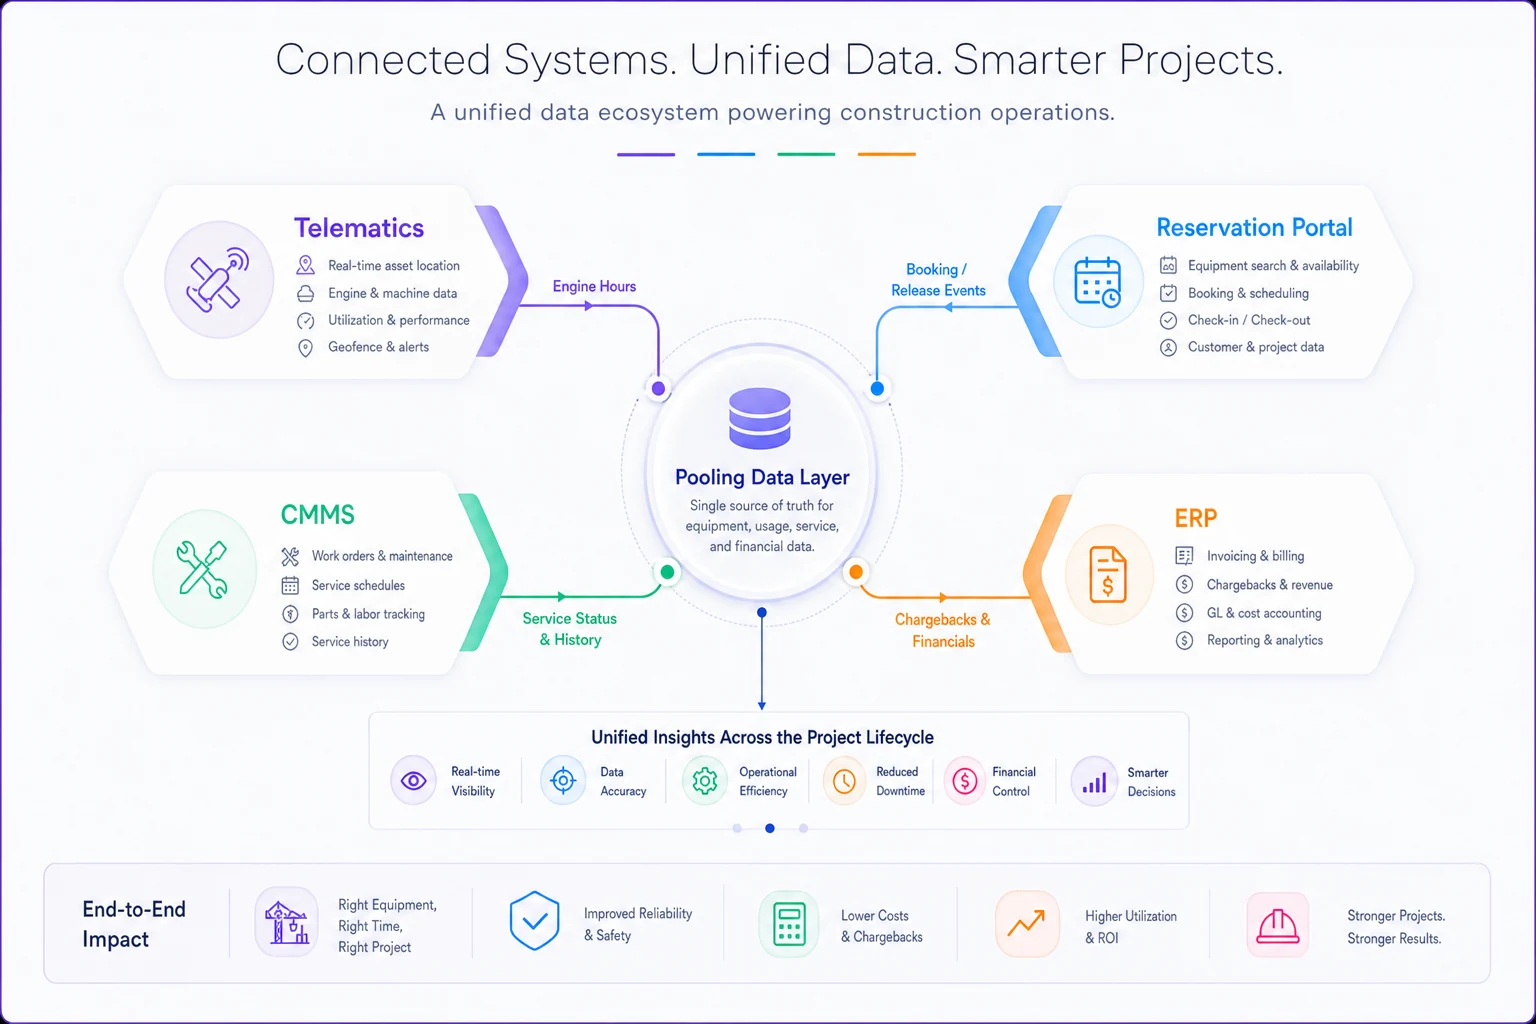
The data flows that matter:
-
Telematics → Pooling layer real engine hours feed utilization automatically. No more "I think it ran most days."
-
Reservation portal → Pooling layer release and receipt events trigger the handoff checklist and transfer cost capture.
-
CMMS → Pooling layer flags assets due for service so you don't transfer a machine into a job right before it needs a week in the shop.
-
Pooling layer → ERP pushes chargebacks to the right cost codes automatically.
Where AI-assisted operational software earns its place is in the reconciliation and scheduling drudgery — matching telematics hours against logged usage to flag discrepancies, suggesting which moves to batch to cut transfer frequency, and generating chargeback entries so finance stops doing it by hand. The manual version of this falls apart somewhere around site number eight. A platform that centralizes these feeds and automates the repetitive matching turns a half-time coordination job into a background process.
Teams that connect even two of these four systems — usually telematics and the reservation portal first — find that the weekly pooling sync drops from an hour of reconstructing what happened to ten minutes of deciding what to do next.
Governance and chargeback examples
Pooling fails politically before it fails financially. If a site "loses" its machine to another site and gets nothing for it, PMs will quietly hoard equipment and the pool dries up. The chargeback model has to make sharing feel fair.
Two models that work in practice:
Usage-based chargeback: Each site pays the pool a per-hour internal rate for actual engine hours used. The pool covers ownership burden. Simple, telematics-driven, and it rewards sites that keep utilization high.
Example: internal rate set at ~$42/hour. Site B uses the shared loader for 96 hours in a month → $4,032 charged to Site B's cost code, credited to the pool. Transparent and non-negotiable because it's metered.
Priority-override compensation: When the scheduler pulls an asset off Site A early to serve a critical-path need at Site C, Site A gets a credit for the disruption — say, the equivalent of a half-day's rental rate. Small, but it keeps the releasing PM from feeling robbed.
The governance principle underneath both: make the fair behavior the easy behavior. If hoarding costs a PM money and sharing earns credit, the system self-regulates.
Three dashboard mockups with thresholds
Dashboards fail when they show everything. Build three focused views, each with explicit thresholds that trigger action.
Dashboard 1 — Portfolio Utilization
-
Utilization % by asset, color-coded
-
Green >65% | Amber: 45–65% | Red: <45%
-
Red assets are either pooling candidates or disposal candidates. The threshold forces the conversation.
Dashboard 2 — Transfer Cost & Frequency
-
Moves per month vs sensitivity-model baseline
-
Cost per move trend
-
Threshold alert if moves/month exceed base-case by >20%, flag for re-sequencing review
-
Watch this one weekly. It's what protects your ROI.
Dashboard 3 — Chargeback & Dispute Status
-
Charges by cost code, current period
-
Open damage disputes with age
-
Threshold any dispute open >7 days escalates to Pilot Lead
-
Unresolved disputes poison inter-site trust faster than almost anything else. Age them visibly.
Keep the dashboards focused and action-oriented; thresholds are how you turn data into decisions.
When this makes sense — and when it doesn't
Pooling implementation is worth it when:
-
You run 3+ concurrent sites within reasonable transfer distance
-
Measured utilization on owned assets sits below ~55%
-
Transfer frequency can realistically be kept low through scheduling
-
You have telematics or can add it cheaply
It's a bad idea when:
-
Sites are far enough apart that transfer cost eats the savings — the number one disqualifier
-
Your projects have near-constant, overlapping demand for the same asset class (just buy enough)
-
You can't commit a coordinator even part-time; unmanaged pools decay fast
Who should skip it entirely: Single-site contractors, or firms whose equipment is so specialized and continuously used that there's no idle time to recover. Pooling solves an idle-capacity problem. No idle capacity, no problem to solve.
A short real scenario
A regional civil contractor with four active sites was renting compaction and small earthmoving equipment on demand, running up roughly $31k–$36k a month in rental across the portfolio. Measured utilization on their four owned machines was sitting around 43%.
They ran an 8-week pilot across two sites with two asset classes. The first couple of weeks were rough — foremen skipped the handoff checklist and one damage dispute dragged on because nobody had photos. Once the checklist stuck and they re-sequenced to cut moves from weekly to roughly every ten days, the numbers settled.
Over the pilot, utilization on the pooled assets climbed to the high 50s, and net savings — after transfer cost, wear, fuel, and coordinator time — came out around $6k–$7k a month on just the two classes they tested. The sensitivity model had predicted $4k–$9k, so reality landed mid-range, which is exactly what you want to see. They scaled to all four sites the following quarter.
What made it work wasn't the equipment or even the software. It was that they measured a real baseline, accounted for every transfer cost honestly, and kept move frequency under control.
The one thing to get right
If you take nothing else from this toolkit: pooling ROI is dominated by transfer frequency, not by utilization uplift alone. Teams model the savings and forget the churn.
Build your sensitivity model so moves-per-month is a front-and-center variable, protect it with scheduling discipline, and watch it on a dashboard every week.
Do that, lock your KPI formulas so finance can reproduce them, and run a contained pilot before scaling — and you'll have something far more durable than a one-time cost cut. You'll have a program that keeps proving itself every month.
Ready to build smarter and faster?
Join 2,000+ construction teams using Projbrick to improve project visibility, reduce delays, and increase profitability.