


Most construction companies running multiple concurrent projects have equipment collecting dust at Site A while Site B is paying premium rental rates for the exact same machine. It happens because project managers work in silos, equipment tracking lives in fragmented spreadsheets, and nobody has real visibility into what's available where.
This cross-site pooling approach fixes that operational blindness. Instead of every project hoarding equipment "just in case" while other sites scramble for rentals, you build a shared pool with clear transfer rules and utilization tracking.
The hidden cost structure of siloed equipment management
Running three concurrent projects without equipment pooling usually looks something like this. Site A holds onto their telehandler for two extra weeks after rough framing wraps because the PM wants it available for potential rework. Site B is renting an identical telehandler at $2,800 per week for facade installation. Site C is sitting on a delayed schedule, waiting for rental availability during peak season.
The financial damage compounds across several layers. Direct rental costs hit first — that unnecessary $2,800 weekly rental when you already own idle equipment sitting somewhere. Then utilization waste kicks in, where owned equipment averages 35-40% utilization instead of the 65-70% that's achievable with pooling. Schedule impacts follow when sites wait on rental availability or pay rush premiums. And then there's maintenance inefficiency from duplicate service contracts and inconsistent tracking across scattered equipment.
A mid-sized contractor running four concurrent projects can easily waste $180,000-$240,000 annually through this kind of fragmentation. The number compounds during busy seasons when rental rates spike and availability drops.
Building your transfer-priority matrix
The foundation of cross-site pooling is a transfer-priority matrix that removes arguments about who gets equipment when multiple sites need it. This isn't about complex algorithms — it's about clear rules everyone understands upfront.
Keep your construction projects on schedule and budget.
Projbrick helps you plan, track, and manage every project phase with precision and ease.
- Real-time project tracking
- Resource & budget management
- Team collaboration tools
No credit card required
-
Critical path impact gets weighted heaviest. If Site A needs the excavator for foundation work on the critical path while Site B wants it for site grading that has float, Site A wins. The scoring is straightforward: critical path activities = 10 points, activities with less than 3 days float = 7 points, activities with 3-10 days float = 4 points, non-critical activities = 1 point.
-
Rental alternative cost provides the economic filter. When Site A can rent locally for $1,200/week but Site B faces $2,400/week due to location or availability, Site B gets priority. Score it as: no rental available = 10 points, rental cost over $2,000/week = 7 points, rental cost $1,000-2,000/week = 4 points, rental under $1,000/week = 1 point.
-
Duration of need prevents equipment camping. A site needing equipment for 2 days scores higher than one planning to hold it for 3 weeks. Less than 3 days = 8 points, 3-7 days = 5 points, 1-2 weeks = 3 points, over 2 weeks = 1 point.
-
Transport distance factors in logistics reality. Moving a boom lift 5 miles between sites works. Moving it 50 miles doesn't make sense. Under 10 miles = 5 points, 10-25 miles = 3 points, 25-50 miles = 1 point, over 50 miles = 0 points (exclude from pool).
Total the scores. Highest score gets the equipment. Ties go to whoever requested first. The value is in the transparency — PMs can calculate their own priority score before requesting, so there are fewer surprises.
| Factor | Scoring |
|---|---|
| Critical path impact | critical path activities = 10 points, activities with less than 3 days float = 7 points, activities with 3-10 days float = 4 points, non-critical activities = 1 point. |
| Rental alternative cost | Score it as: no rental available = 10 points, rental cost over $2,000/week = 7 points, rental cost $1,000-2,000/week = 4 points, rental under $1,000/week = 1 point. |
| Duration of need | Less than 3 days = 8 points, 3-7 days = 5 points, 1-2 weeks = 3 points, over 2 weeks = 1 point. |
| Transport distance | Under 10 miles = 5 points, 10-25 miles = 3 points, 25-50 miles = 1 point, over 50 miles = 0 points (exclude from pool). |
Visualizing the scoring flow can help PMs learn the process quickly.
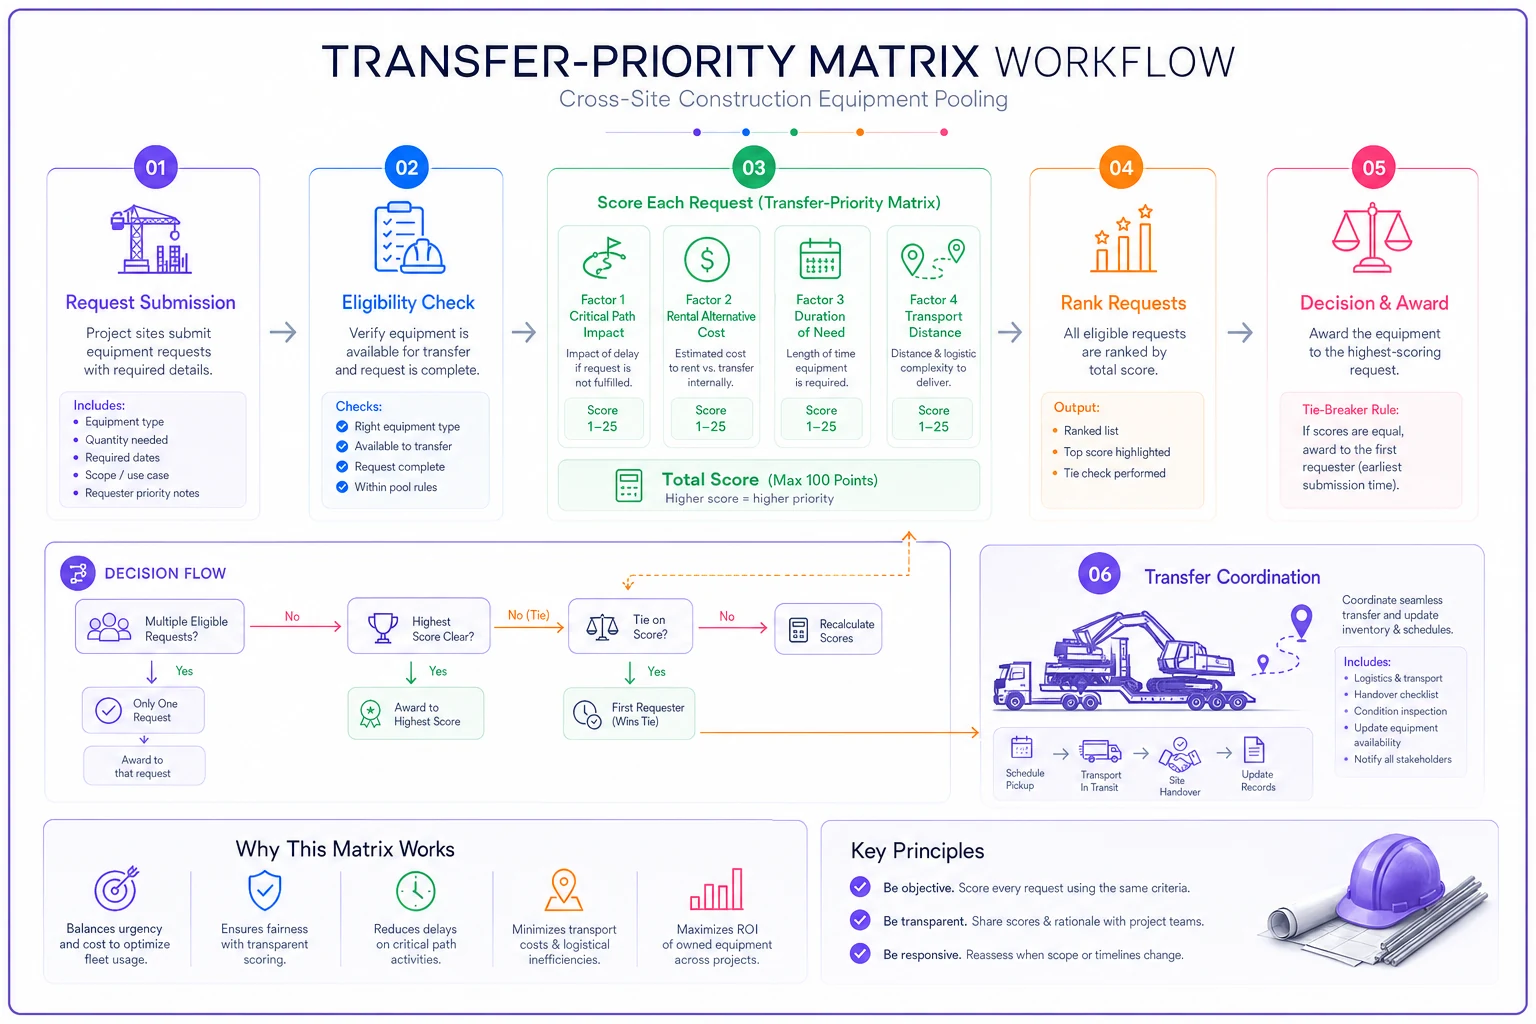
Place this matrix somewhere accessible so PMs can calculate priority before requesting equipment.
Utilization KPIs that actually drive behavior
Tracking matters only when the metrics connect to real decisions. Most companies track overall fleet utilization as a percentage, then wonder why behavior never changes. The problem is that number tells you almost nothing actionable.
-
Revenue-hours per unit per month shows actual productivity. A skid steer generating 120 revenue-hours monthly performs better than one logging 160 hours with 80 of those sitting idle between tasks. Track productive hours where equipment directly enables billable work, not just time sitting on site.
-
Transfer velocity measures how quickly equipment moves to where it's needed. Calculate days from request to arrival. Target under 2 days for equipment within 15 miles. Anything over 4 days signals process friction that needs addressing.
-
Idle cost per project makes waste visible at the project level. Calculate (idle days × daily ownership cost) for each piece of equipment assigned to a project. When a PM sees their project carrying $8,000 in idle equipment costs, behavior shifts pretty quickly.
Display these on a simple dashboard updated weekly. Don't bury them in monthly reports — post them where dispatch and PMs see them regularly.
Scheduling rules that prevent conflicts
The worst outcome in equipment pooling is two sites expecting the same machine Monday morning. Clear scheduling rules prevent these collisions.
-
The 72-hour lock rule
-
The standing reservation system
-
The pool exclusion list
-
The maintenance window protocol
-
The weather float rule
The 72-hour lock rule: Once equipment is confirmed for a specific task, that reservation locks 72 hours before start time. No exceptions unless both PMs agree. This gives the receiving site time to adjust crew schedules if plans change.
The standing reservation system: Certain equipment-task combinations repeat weekly — like a telehandler for Thursday steel deliveries. These get standing reservations that auto-renew unless released 5 days ahead. Prevents the same coordination conversation from happening every week.
The pool exclusion list: Some equipment stays outside the pool. Specialized machines required for specific project phases get excluded, as does any equipment that costs more to transport than a one-week rental would run.
The maintenance window protocol: Equipment needing service within 50 operating hours gets flagged. The current site must release it with enough lead time for maintenance before the next reservation. Miss that window and that site covers rental costs if the next site needs alternative equipment.
The weather float rule: For weather-sensitive equipment like pavers or boom lifts, sites can claim a 48-hour weather float that extends their reservation if conditions prevent work. They need to provide weather service documentation showing wind speeds or precipitation that exceeded safe operating limits.
Real-world implementation: 3-month case example
Here's how Brennan Construction deployed this system across four concurrent projects in the Phoenix metro area.
Month 1 — Setup and baseline
Weeks 1-2: They inventoried equipment across all sites. Found 31 pieces of equipment valued at $1.8M. Built a simple shared spreadsheet listing equipment, current location, and condition. Nothing elaborate.
Week 3: Built the priority matrix scoring system. Trained PMs in a 30-minute morning meeting. Key discovery: they found $47,000 in duplicate rentals almost immediately — two sites renting compactors while one sat idle at the yard.
Week 4: Launched basic tracking. Each PM submitted weekly equipment needs every Wednesday for the following week. The operations coordinator manually matched requests using the priority scoring.
First month results: Eliminated $31,000 in redundant rentals just from visibility. No complex systems yet, just awareness of what existed where.
Month 2 — Active pooling
Weeks 5-6: Started actual transfers. The first week was rough — three coordination failures where equipment arrived late or at the wrong location. They created a simple handoff checklist: photos of condition, hour meter readings, fuel level, transport coordination confirmed.
Week 7: Refined transport coordination. Assigned one person as "equipment dispatcher" for about 2 hours each Monday and Thursday. Fixed roughly 80% of the confusion.
Week 8: First real conflict resolution using the matrix. Two sites wanted the excavator. Site A (foundation dig on critical path) scored 27 points. Site B (parking lot prep with float) scored 11 points. Site A got it. Site B's PM initially pushed back but accepted the transparent scoring.
-
Rental costs dropped from $67,000 to $43,000
-
Average equipment utilization increased from 38% to 52%
-
Completed 28 equipment transfers, 23 successful, 5 with issues
Month 3 — Optimization
Weeks 9-10: Added KPI tracking to a simple Google Sheet pulling from their existing job cost system. PMs could suddenly see their idle costs. One PM immediately released three pieces of equipment he'd been hoarding.
Week 11: Implemented standing reservations for repetitive needs. Concrete crews no longer had to request the same equipment every week.
Week 12 — end of quarter review:
-
Reduced equipment rental spend by $112,000 (47% reduction)
-
Increased owned equipment utilization to 64%
-
Eliminated 6 project delays tied to equipment availability
-
Reduced equipment-related coordination emails and calls by roughly 70%
The system paid for itself in about 3 weeks. The only technology cost was a $15/month form builder for equipment requests.
Common failure points and fixes
The hoarding problem: PMs hold onto equipment "just in case" despite the idle costs. Fix: charge idle costs directly to project budgets after 3 days of non-use. When it starts hitting their project margins, the behavior changes.
The condition dispute: Site A claims Site B damaged equipment during their use. Fix: mandatory photo documentation at transfer — takes 2 minutes, prevents week-long arguments. Set a simple damage threshold ($500) below which you don't waste time investigating.
The transport bottleneck: Nobody wants to handle equipment transport coordination. Fix: rotate the dispatcher role weekly among project coordinators, or make it part of someone's formal job description with a defined time allocation. For four to five concurrent projects, expect around 6-8 hours weekly.
The "emergency" override: Every request becomes "emergency priority" when PMs game the system. Fix: limit each PM to one emergency override per month. They'll use it carefully.
The maintenance gap: Equipment comes due for service while allocated to a critical task. Fix: track hours-to-service in your allocation system and block equipment from new allocations when it's within 40 hours of service requirements.
Technology integration without complexity
You don't need elaborate systems to make pooling work, but the right tools accelerate results. The core challenge isn't technology — it's getting accurate data on equipment location and status without creating extra administrative burden.
Small contractors can start with a shared spreadsheet and a group chat for coordination. That alone typically cuts rental costs by 20-30% in the first month through basic visibility.
For growing operations, moving to AI-powered operational software that handles equipment tracking alongside your other project coordination makes the difference between a system people actually use versus one they work around. When equipment requests flow through the same platform as RFIs, submittals, and daily reports, PMs don't have to learn separate systems or duplicate data entry. The right platform can automate utilization calculations from timesheet entries, route transfer requests based on your priority matrix, flag maintenance windows before equipment gets double-booked, and let operators update location and hour meters from the field.
Companies that integrate equipment pooling into their existing operational workflow consistently hit 60-70% utilization rates. Those running it as a separate system tend to plateau around 45-50% because the friction prevents consistent use.
Measuring real ROI beyond rental savings
Rental cost reduction is the obvious metric everyone tracks, but that's maybe 40% of the actual value from pooling. The bigger wins are in operational improvements that compound over time.
Schedule reliability improves when equipment availability becomes predictable. Projects hitting milestones on time generates 2-3x more value than rental savings through avoided liquidated damages, faster payment collection, and maintaining crew continuity between phases.
Maintenance cost per operating hour drops 20-25% when you centralize service tracking and batch maintenance windows. Instead of reactive repairs and emergency service calls, you're planning maintenance during natural idle periods between projects.
Equipment lifespan extends by roughly 15-20% when utilization stays consistent instead of alternating between months of idle deterioration and periods of overuse to catch up.
Capital efficiency improves as you need fewer total units to serve the same project load. Most contractors can trim fleet size by 15-20% after a year of effective pooling while maintaining the same project capacity.
Track these quarterly:
-
Total equipment capital deployed ÷ annual revenue
-
Average equipment age at replacement
-
Maintenance cost per operating hour
-
Schedule delays attributed to equipment availability
-
Equipment-related change orders and claims
The full ROI picture typically shows a 3-4x return within the first year, with benefits accelerating as teams get comfortable with the pooling rhythm.
Cross-site equipment pooling isn't complicated, but it does require structure and consistency. The companies doing this well don't have elaborate systems — they have clear rules, transparent scoring, and basic tracking that everyone understands.
Start simple. Pick your five most expensive pieces of equipment and implement pooling just for those. Use a basic spreadsheet and the priority matrix. Once that holds for a month, expand and refine from there. Building an elaborate system before you understand what actually needs tracking is the fastest way to kill adoption.
The construction companies that get equipment allocation right eliminate the expensive absurdity of idle owned equipment sitting next to rented duplicates. In a business where 2-3% net margins are considered healthy, removing even half your redundant equipment costs can meaningfully move the needle on profitability. The playbook above shows exactly how to capture that value without adding administrative overhead that nobody will actually maintain.
Ready to build smarter and faster?
Join 2,000+ construction teams using Projbrick to improve project visibility, reduce delays, and increase profitability.