



Most schedule blowups don't start with a missed pour or a late permit. They start weeks earlier, buried in a resource plan that looked fine on paper but fell apart the moment it hit the field. A crew shows up short a certified welder. A concrete pump is stuck two sites over. The lookahead assumed 14 people available, and 9 showed.
Resource forecasting is one of those things everyone claims to do and almost nobody does well. The gap isn't intelligence or effort — it's method. Teams forecast labor and equipment in separate spreadsheets, updated by different people, on different days, using different assumptions. The result is a plan that's internally inconsistent before the job even breaks ground.
This is a systems problem. What follows is a practical method that ties three moving parts together: capacity forecasting, a skill matrix that reflects who can actually do what, and cross‑site equipment pooling. Individually these are common ideas. The value is in how they connect — because that's exactly where most forecasts fall apart.
Why resource forecasts break, and why they break the same way every time
The typical failure isn't a bad number. It's three plans that don't talk to each other.
Labor forecasts usually come from the schedule: the P6 or MS Project file spits out a resource histogram, someone eyeballs it, and it becomes the plan. The problem is that a resource histogram counts heads, not skills. It'll happily tell you that you need "8 electricians" in week 12 without noticing that only 2 of them are qualified to terminate the switchgear on the critical path.
Equipment forecasts, meanwhile, live in a separate universe — usually the yard manager's head or a rental log. And capacity, the thing that should reconcile all of it, is almost never modeled honestly. Most teams forecast at 100% availability. Nobody runs at 100%. Between PTO, sick days, training, rain days, and the guy who's technically on your job but keeps getting pulled to fix problems elsewhere, real available capacity usually lands somewhere between 70% and 85% of headcount.
Worth naming directly: forecasts fail at the seams, not in the middle of any single discipline. The labor plan is fine. The equipment plan is fine. The schedule is fine. They just don't agree with each other, and no single person owns the reconciliation.
This gets worse at scale. On one project you can hold the whole picture in your head. Run three or four concurrent jobs sharing a labor pool and an equipment yard, and the informal system collapses. Two PMs both "reserve" the same crane for the same Tuesday. Neither is lying. Neither wrote it down anywhere the other could see.
Start with capacity, not demand
Almost everyone forecasts demand first — how many people and machines the schedule needs. Flip it. Start with honest available capacity, because that's the constraint that actually blows schedules.
Keep your construction projects on schedule and budget.
Projbrick helps you plan, track, and manage every project phase with precision and ease.
- Real-time project tracking
- Resource & budget management
- Team collaboration tools
No credit card required
Build a rolling capacity number per trade and per key piece of equipment. Not the nameplate headcount — the effective number after you subtract the predictable losses. Here's a simple way to model it that field PMs can maintain without a data science degree:
Effective capacity = nominal headcount × availability factor × productivity factor
-
Availability factor accounts for PTO, absenteeism, training, weather exposure. For most trades this lands around 0.80–0.88. Outdoor trades in a rainy quarter drop lower.
-
Productivity factor accounts for the difference between "on site" and "productively producing." New crews ramping, congested work areas, and heavy rework pull this down. Fresh crews on a tight urban floor plate often run 0.70–0.85 until they find their rhythm.
A crew of 12 laborers is rarely 12 units of capacity. At 0.85 availability and 0.80 productivity, you're realistically getting the output of about 8 people. If your demand forecast assumed 12, you're already 30% short in week one before you've hit a single site problem.
The insight most teams miss: the availability and productivity factors aren't guesses you make once. They're numbers you calibrate from your own recent jobs. After a couple of projects you'll know your framing crews run at roughly 0.82 productivity for the first three weeks of any new building, then climb. That's a forecasting input, not a surprise.
The skill matrix that reconciles heads and capabilities
A resource histogram treats every electrician as interchangeable. Field reality doesn't work that way. Your forecast needs to know not just how many people, but who can do what — because the binding constraint is almost always a specific certified skill, not raw headcount.
A workable skill matrix is a grid: people down the side, competencies across the top, proficiency level in each cell. Keep the levels simple so people actually maintain it:
| Level | Meaning | Can they run it solo? |
|---|---|---|
| 0 | No capability | No |
| 1 | Assist only / in training | No — needs supervision |
| 2 | Competent, works independently | Yes |
| 3 | Expert, can lead and train others | Yes, and supervises L1s |
The competencies shouldn't be job titles — they're the specific things that gate your schedule. For a mechanical fit‑out that might be: pipe brazing, medical gas certification, VRF commissioning, BMS integration, confined‑space entry. For structures: post‑tension stressing, self‑climbing formwork, rebar detailing sign‑off.
Overlay this on the schedule. Instead of asking "do we have 8 electricians in week 12," you ask "do we have at least 2 Level‑3 switchgear‑qualified people during the energization window." Suddenly a forecast that looked green turns red — and it turns red weeks before the crew shows up, when you can still do something about it.
The mistake to avoid: building a beautiful 40‑competency matrix that nobody updates. Track only the skills that actually constrain schedule or carry certification risk. If a competency being absent can't stop or slow the job, leave it off. Ten to fifteen gating skills per trade is plenty.
A concrete look at how this catches problems
Say your six‑week lookahead has switchgear energization starting Monday of week 5. Headcount forecast: fine, you've got 6 electricians. Skill matrix check: only one person is Level 3 on medium‑voltage terminations, and he's tentatively scheduled to be at another site that week. That's not a week‑5 problem — that's a right now problem. You either lock him in, get a second person certified, or line up a specialty sub, and you have four weeks to do it instead of finding out Monday morning.
Without the matrix, this shows up as a "surprise" delay. With it, it's a scheduling decision made calmly in advance. Same facts, completely different outcome.
Cross‑site equipment pooling without the double‑booking chaos
Equipment is where concurrent projects quietly bleed money and schedule. Idle machines on one site while another rents the same thing. A pump reserved by two PMs. A telehandler that "belongs" to whichever job shouted loudest.
The fix isn't a fancy asset tracker — it's a shared, forward‑looking allocation calendar with clear decision rules. The calendar shows every shared major asset across all active sites, with committed windows and requested windows visually separated. Once you can see the whole pool, most conflicts become obvious weeks ahead.
But visibility alone doesn't resolve competition. You need decision rules for when two sites want the same asset. A simple, defensible priority hierarchy:
-
Critical path beats float. A task with zero float wins over a task with 5 days of float, every time. This is the rule that stops the loudest PM from winning by default.
-
Committed inspection or pour windows beat flexible work. Anything with an external dependency — inspector booked, concrete ordered, closure permit issued — outranks work you can slide.
-
Shorter‑duration need wins the tiebreak. If two tasks are both critical, giving the asset to the 1‑day need first frees it faster than the 4‑day need would.
-
Escalate anything still tied after those three rules to the resource owner — don't let two PMs negotiate it privately, because that's how the same crane gets promised twice.
Pooling doesn't fail because of the machines. It fails because there's no single source of truth and no rule for who wins. Fix those two things and utilization climbs without anyone buying or renting more.
A quick worked example on the pooling math
Three concurrent sites, one shared concrete pump. Rented on‑demand, each mobilization runs a few thousand dollars plus the day rate. Before pooling, each site called for its own pump independently — roughly 4–5 mobilizations a month across the three jobs, with plenty of idle days where a pump sat on one site "just in case."
Run it through a shared calendar with the priority rules, and you sequence pours so one pump covers all three sites with maybe 2–3 mobilizations a month and far less idle standby. On a multi‑month job the savings land somewhere in the low tens of thousands, and — this matters more than the money — you stop the double‑booking that was causing pour‑day scrambles.
Wiring the three parts into one forecast
Here's the workflow that ties capacity, skills, and equipment into a single forecast the field can actually run. Weekly rhythm.
-
Pull demand from the schedule. Export resource requirements for the next 6 weeks by trade and by key equipment. This is your raw demand.
-
Convert nominal demand to skill‑specific demand. For each critical task, note the gating competency and required proficiency level, not just the trade. Now demand reads "2× L3 switchgear," not "6 electricians."
-
Compare against effective capacity. Apply your availability and productivity factors to nominal headcount. Check the skill matrix for whether the specific qualified people are actually available in that window.
-
Overlay the equipment pool calendar. Confirm every major shared asset is committed to your windows, applying the priority rules where two sites collide.
-
Flag the seams. Any point where skill‑specific demand exceeds qualified capacity, or where an asset is double‑committed, gets a red flag with a date and an owner.
-
Act on flags with lead time, not on the day. Cross‑train, pre‑book a specialty sub, resequence, or negotiate the pool — while there's still runway.
Here's a quick visual of that weekly rhythm to make the steps easier to run in the field.
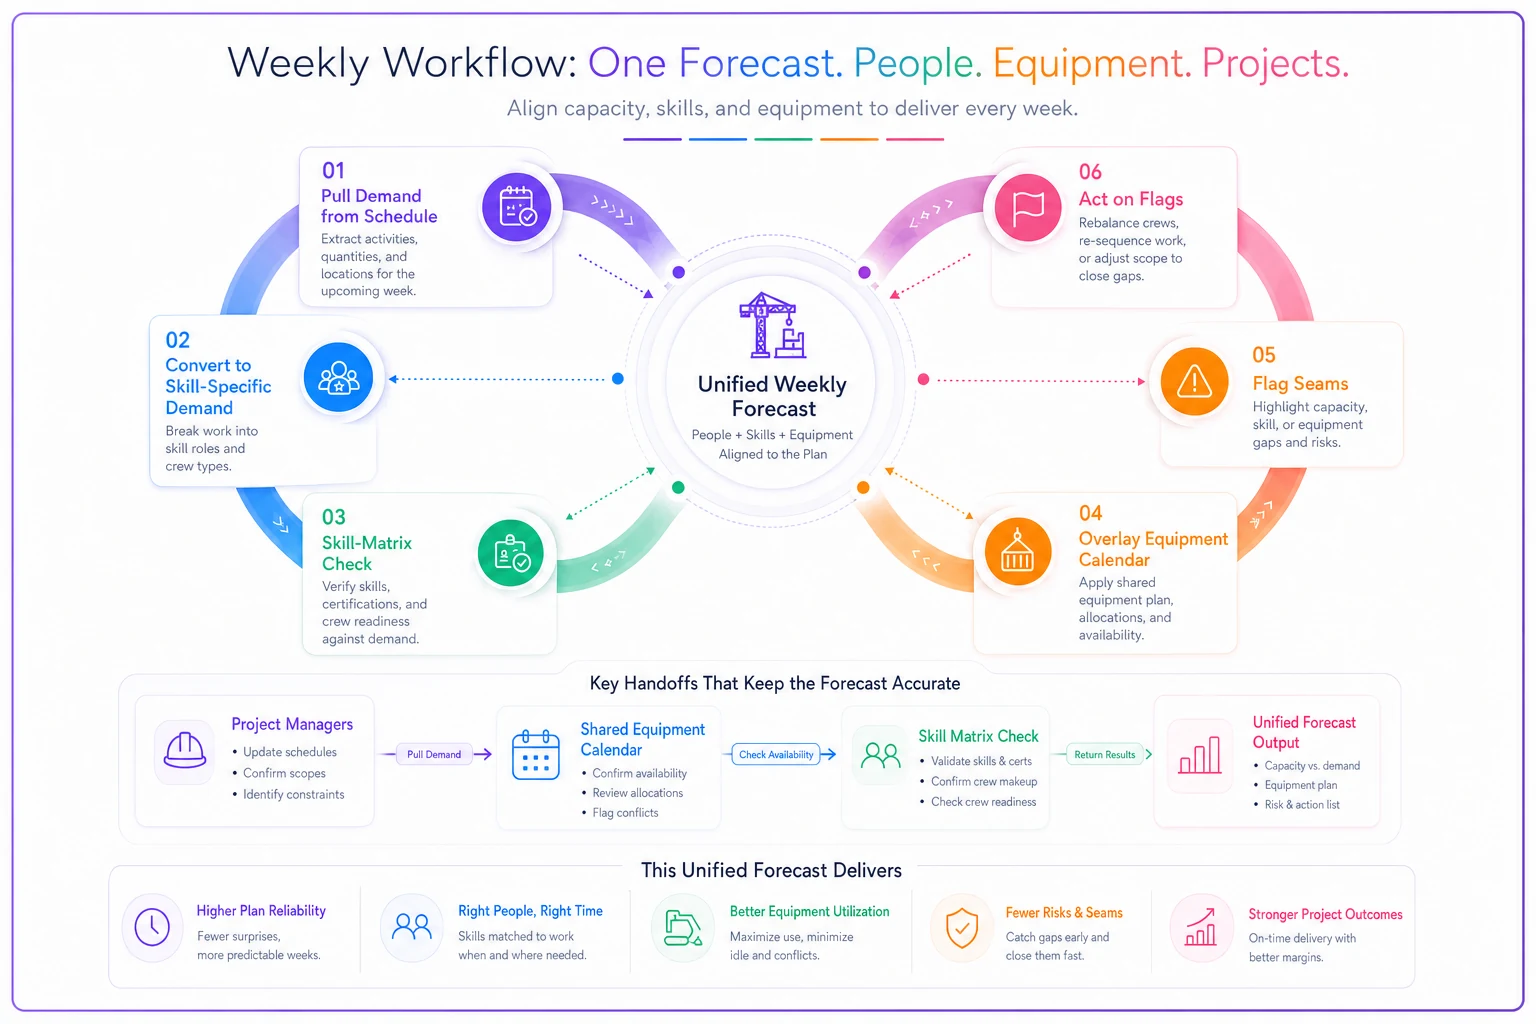
The whole point is step 5. A forecast that only tells you headcount is short is nearly useless. A forecast that tells you which specific skill, on which date, for which task is the constraint — that's something a PM can act on Monday morning.
Where this gets hard to run by hand
For a single project, a couple of well‑built spreadsheets will get you most of the way there. Honestly, that's the right place to start — don't buy software to solve a problem you haven't manually solved once.
It stops scaling the moment you go concurrent. Three sites sharing a labor pool and an equipment yard means three schedules changing daily, one skill matrix that everyone edits, and one equipment calendar that everyone competes for. Keeping those spreadsheets in sync by hand becomes a full‑time job, and the version‑control failures alone will burn you — someone forecasts off last Tuesday's copy and reserves a crane that's already gone.
This is where a shared operational platform starts earning its keep. Not for the buzz — for the boring reasons: one live skill matrix instead of five copies, an equipment calendar every PM sees at once, demand pulled from the schedule automatically so the forecast isn't stale the day after you build it. AI‑assisted tooling helps most in the reconciliation step — flagging where skill‑specific demand outruns qualified capacity, or where two sites have quietly committed the same asset, so a human doesn't have to cross‑check thousands of cells manually. The judgment stays with the PM; the software just makes sure nothing falls through the gap between three disconnected plans.
When this method makes sense — and when it doesn't
Run the full system when:
-
You're managing two or more concurrent projects sharing labor or equipment.
-
Your critical path depends on specific certified skills, not generic headcount.
-
You've been burned by "surprise" resource shortfalls that were actually predictable.
Keep it lightweight when:
-
You're running a single small project with a stable, known crew. A one‑page skill list and a simple histogram is fine — don't over‑engineer.
This is the wrong tool when:
Your real problem is scope or design churn, not resources. No forecasting method survives a schedule that changes weekly for reasons unrelated to capacity. Fix the churn first.
The teams that get the least out of this are the ones who build the matrix and the calendar, then never update them. A stale forecast is worse than no forecast, because people trust it. The discipline of the weekly rhythm matters more than the sophistication of the model.
A short real scenario
A regional GC running three concurrent fit‑out projects — two office floors and a small clinic — kept hitting the same wall: crews showing up without the one certified person the day's critical work needed, and their two concrete pumps constantly double‑booked across sites.
They built the three‑part system over about a month. Effective‑capacity numbers calibrated from their last two jobs (framing crews landed at roughly 0.82 productivity early, climbing after week three). A 14‑competency skill matrix per trade, tracking only gating skills like med‑gas and BMS commissioning. One shared equipment calendar with the priority rules.
The first thing it caught was the clinic's medical‑gas certification window — they had exactly one qualified person, already booked at another site the same week. Four weeks of warning meant they lined up a specialty sub calmly instead of scrambling. Over the quarter, pump mobilizations dropped by roughly a third, and the skill shortfalls that had been costing them a day or two per occurrence mostly stopped showing up as surprises — not because problems stopped happening, but because they started appearing on the forecast weeks before they hit the field.
The number that moved wasn't dramatic on paper. But a schedule that used to slip in unpredictable chunks became predictable, and predictable is what lets you actually plan the next job.
Pulling it together
Resource forecasting doesn't blow schedules because PMs are bad at math. It blows schedules because labor, skills, and equipment get forecast separately and never reconciled — and the failure always shows up at the seams between those plans, usually as a "surprise" that was sitting in the data the whole time.
The method is straightforward: model capacity honestly instead of assuming 100% availability, forecast skills instead of headcount so certification gaps surface early, pool equipment against one shared calendar with clear priority rules, and run a weekly rhythm that flags the seams with enough lead time to act. Start it in spreadsheets on one project. Move to a shared platform when concurrency makes the manual version impossible to keep in sync.
Do that, and the forecast stops being a document you produce for the owner and starts being a tool that tells you, weeks ahead, exactly which crew, which skill, and which machine is about to become your problem — while you still have time to fix it.
Ready to build smarter and faster?
Join 2,000+ construction teams using Projbrick to improve project visibility, reduce delays, and increase profitability.